
Komari is a minimalist monitoring tool for Unix systems that provides essential system metrics with a simple interface. Also, it's written in Go – love it.
Let's be honest: there are many open source monitoring tools available, e.g Uptime Kuma was running on my server before, but I didn't really like it after all. This one the other hand had a really clean interface, and yes, I had to translate it from Chinese to English, but you can't blame me – they have this cute theme going on, I mean, what did you expect?
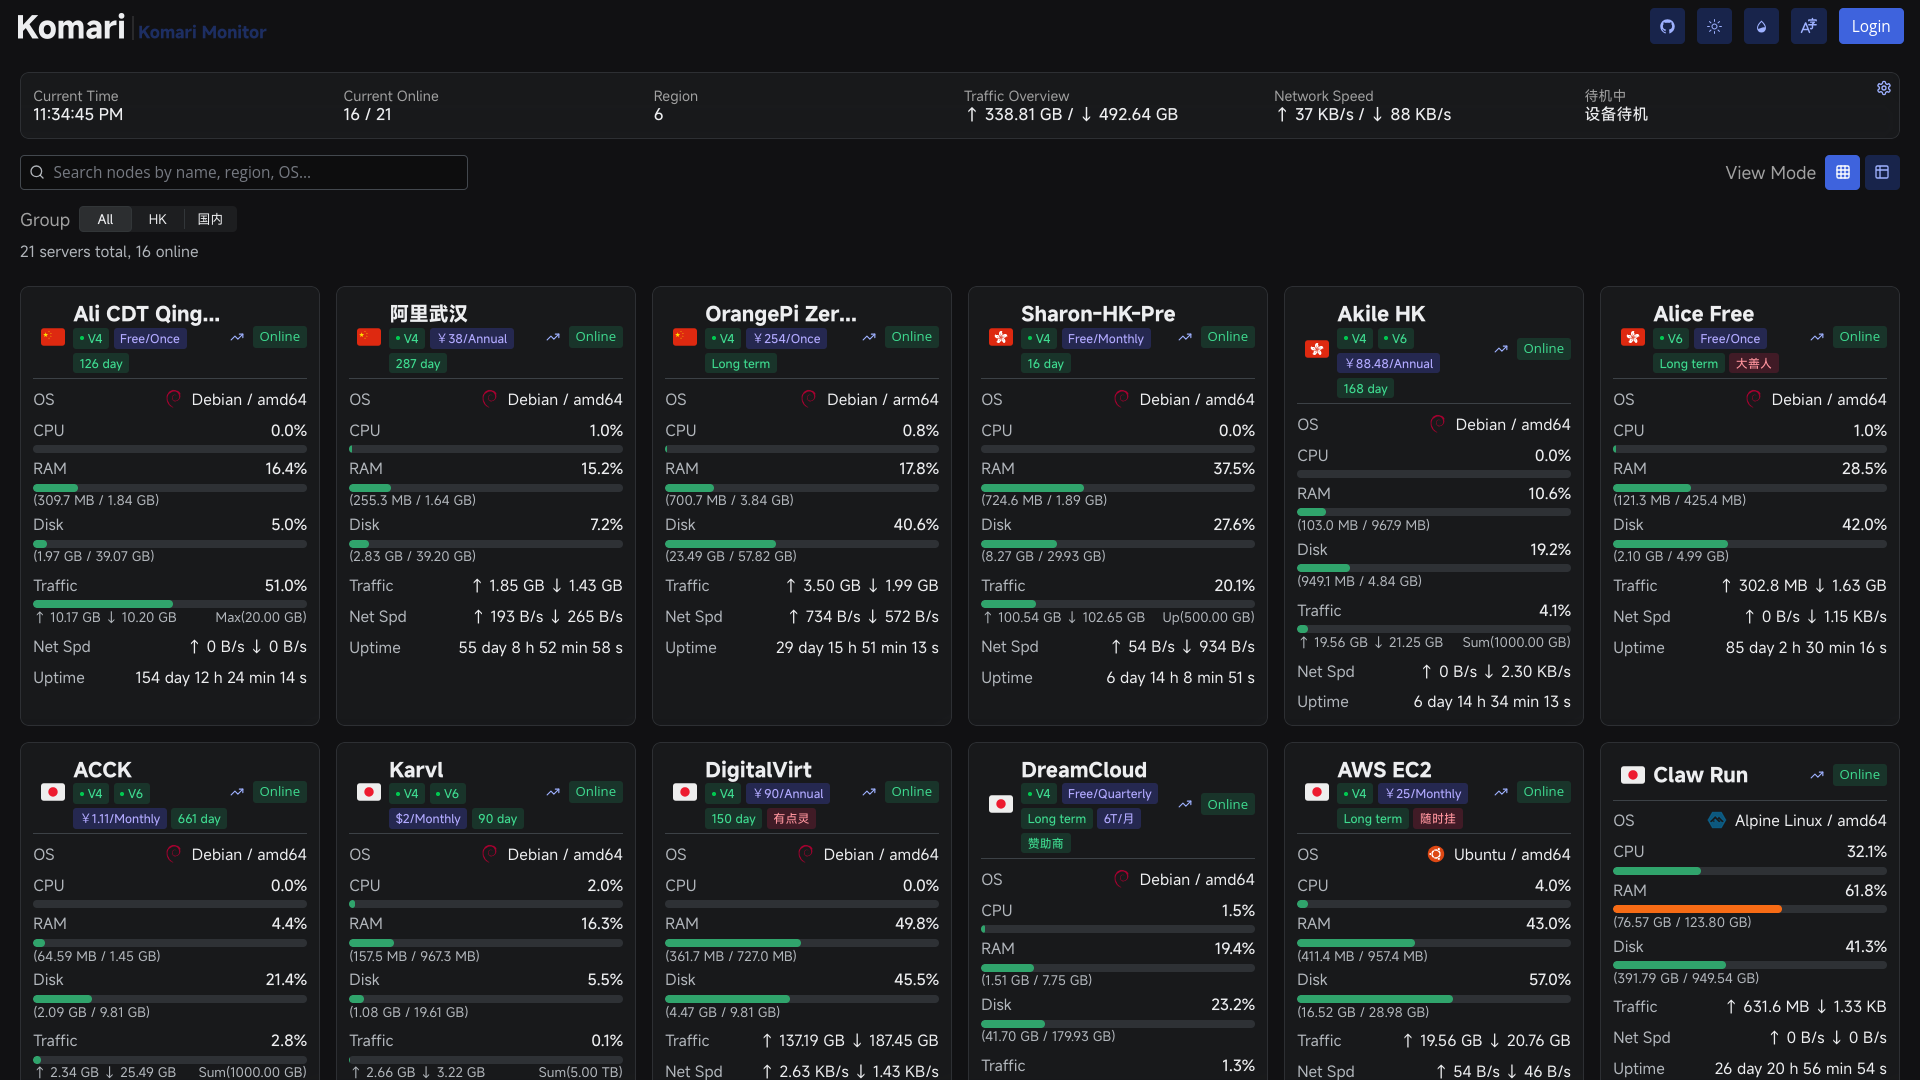
Introduction
Komari follows the following structure:
- Komari Monitor: A Full Stack app that displays the metrics coming from
Komari Agent(s). One for all your monitored nodes. - Komari Agent: A lightweight agent that collects system metrics and sends them to the
Komari Monitor. One per node.
Installation
Komari Monitor
I really suggest installing Komari Monitor using Docker, as it's the easiest way to get it up and running. You can use the following command to run it:
-
Clone the repository
-
Run the following commands in your terminal:
# Create a data directory to persist data
mkdir -p ./data

# Run Komari Monitor using Docker
docker run -d \
-p 25774:25774 \
-v $(pwd)/data:/app/data \
--name komari \
--restart unless-stopped \
ghcr.io/komari-monitor/komari:latest
You can specify
ADMIN_USERNAMEandADMIN_PASSWORDenvironment variables to set your admin credentials. By default,ADMIN_USERNAMEisadminandADMIN_PASSWORDis generated on the first run and outputted in the logs.
To view the logs, use the command:docker logs komari
To add the environment variables, add-e ADMIN_USERNAME=your_username -e ADMIN_PASSWORD=your_passwordto thedocker runcommand. -
Run
docker logs komarito get the admin password.devnyxie@torpedo-server:~/apps/komari$ docker logs c456888824e2 2025/10/26 20:33:26 Komari Monitor 1.1.2a (hash: d9c26e43a98c0a796e3dc7ca9c85121b4cfc5c14) 2025/10/26 20:33:26 Using SQLite database file: /app/data/komari.db 2025/10/26 20:33:26 Application timezone is set to 'UTC'. 2025/10/26 20:33:26 Default admin account created. Username: admin , Password: xLZmlooUVc5Q -
Access the Komari Monitor web interface at
http://localhost:25774and log in with the admin credentials. -
Add a new agent with a name of choice.

-
Get the Install Command for the agent.


Make sure to replace the URL if necessary. It must be the URL that your agent can reach the monitor at. So if my agent is on my local network, and my monitor is hosted on remote - I need to use the public URL of my monitor.
This is the structure of the command:
bash <(curl -sL https://raw.githubusercontent.com/komari-monitor/komari-agent/refs/heads/main/install.sh) -e MONITOR_URL -t AGENT_ID
Komari Agent
To install the Komari Agent on your Unix system, run the install command you obtained from the Komari Monitor setup. This command will download and install the agent, configure it to communicate with your Komari Monitor, and start collecting system metrics.
The provided syntax didn't work on my ubuntu systems, I was getting the following error:
bash: /dev/fd/63: No such file or directoryTo fix this, I had to modify the command:
curl -sL https://raw.githubusercontent.com/komari-monitor/komari-agent/refs/heads/main/install.sh | sudo bash -s -- -e MONITOR_URL -t AGENT_IDIf you made a mistake, feel free to uninstall the agent and try again!
# Purge Komari Agent
sudo systemctl stop komari-agent
sudo systemctl disable komari-agent
sudo rm /etc/systemd/system/komari-agent.service
sudo rm -rf /opt/komari
sudo systemctl daemon-reload
After installation, the agent will start and auto-register systemd service to ensure it runs on system startup. Surprisignly, the agent is very lightweight and consumes minimal resources.
Testing
Once the agent is installed and running, you can verify its status by checking the logs:
sudo journalctl -u komari-agent -fIf everything is set up correctly, you should see logs indicating that the agent is able to connect to the Komari Monitor and is sending system metrics.
username@server:~/apps/komari$ sudo journalctl -u komari-agent -f
[sudo] password for username:
Oct 26 22:03:40 torpedo-server agent[197428]: 2025/10/26 22:03:40 Get IPV4 Success: IPv4Address
Oct 26 22:03:41 torpedo-server agent[197428]: 2025/10/26 22:03:41 Get IPV6 Success: IPv6Address
Now, you can refresh the Komari Monitor web interface, and you should see the newly added agent along with real-time system metrics.
